Instacart Market Basket Analysis Part 1: Exploratory Data Analysis
Instacart market basket analysis was a Kaggle competition that was opened early 2016 and was conducted by Instacart.
What is Instacart?
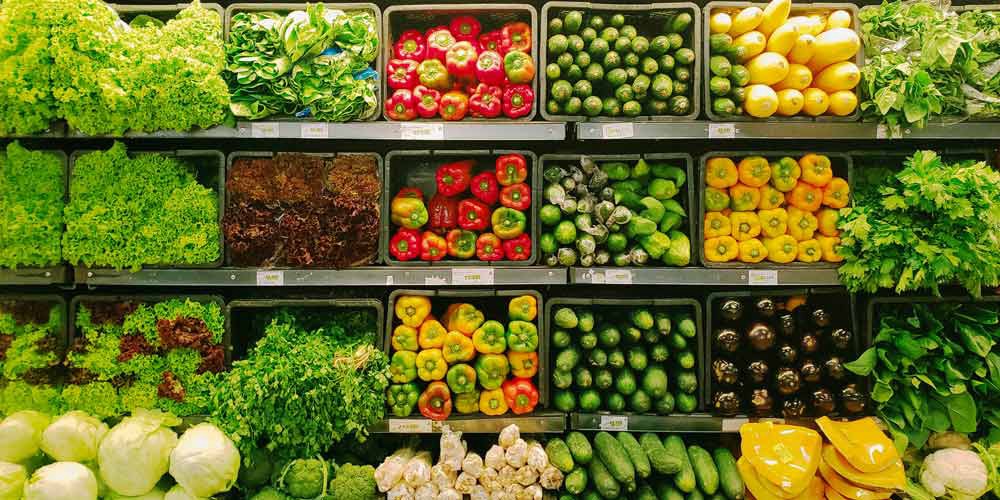
Instacart is a grocery ordering and delivery app that aims to make it easy to fill refrigerator and pantry with personal favorites and staples when needed. After selecting products through the Instacart app, personal shoppers review the order and do the in-store shopping and delivery for customers.
Instacart uses transaction data to develop models that predict which products a user will buy again, try for the first time, or add to their cart next during a session. The objective for this competition was to use the data on customer orders over time to predict which products will be in a user’s next order.
About the Dataset
The dataset is anonymized and contains a sample of over 3 million grocery orders from more than 200,000 Instacart users. For each user, the dataset provides between 4 and 100 of their orders, with the sequence of products purchased in each order.
Instacart has also taken great care to protect the privacy of their users and retail partners and to ensure that the data is entirely anonymous:
- The only information provided about users is their sequence of orders and the products in those orders.
- All of the IDs in the dataset are entirely randomized, and cannot be linked back to any other ID.
- Only products that are bought by multiple people at multiple retailers are included, and no retailer ID is provided.
This dataset includes orders from many different retailers and is a heavily biased subset of Instacart’s production data, and so is not a representative sample of their products, users or their purchasing behavior.
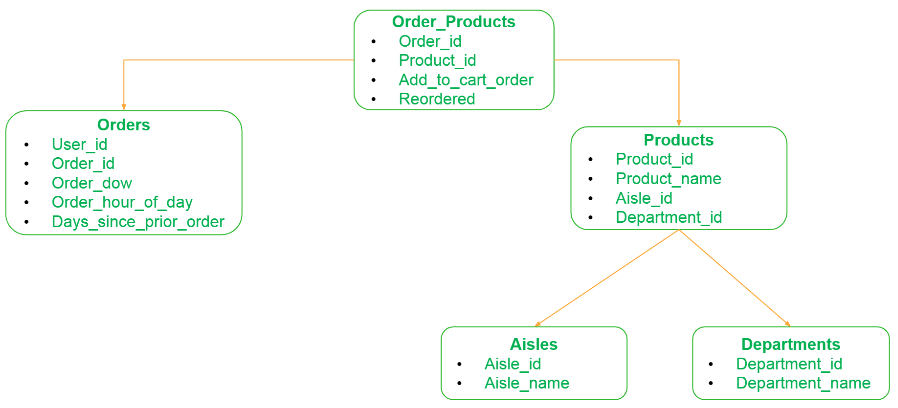
The description of each variable is outlined below;
1. orders dataset:
- order_id: order identifier
- user_id: customer identifier
- eval_set: which evaluation set this order belongs in (see train and prior dataset described below)
- order_number: the order sequence number for this user (1 = first, n = nth)
- order_dow: the day of the week the order was placed on
- order_hour_of_day: the hour of the day the order was placed on
- days_since_prior: days since the last order, capped at 30 (with NAs for order_no = 1)
2. products dataset:
- product_id: product identifier
- product_name: name of the product
- aisle_id: foreign key
- department_id: foreign key
3. aisles dataset:
- aisle_id: aisle identifier
- aisle: the name of the aisle
4. departments dataset:
- department_id: department identifier
- department: the name of the department
5. order_products_prior and train datasets:
- order_id: foreign key
- product_id: foreign key
- add_to_cart_order: order in which each product was added to cart
- reordered: 1 if this product has been ordered by this user in the past, 0 otherwise
“prior”: orders prior to that users most recent order; “train”: training data supplied to participants of the competition; “test”: test data reserved for machine learning competition
Data Exploration
Code for all the graphs represented below are present in this GitHub repository.
Validating 4-100 orders of customer
Let’s validate the claim that 4 to 100 orders of a customer are given
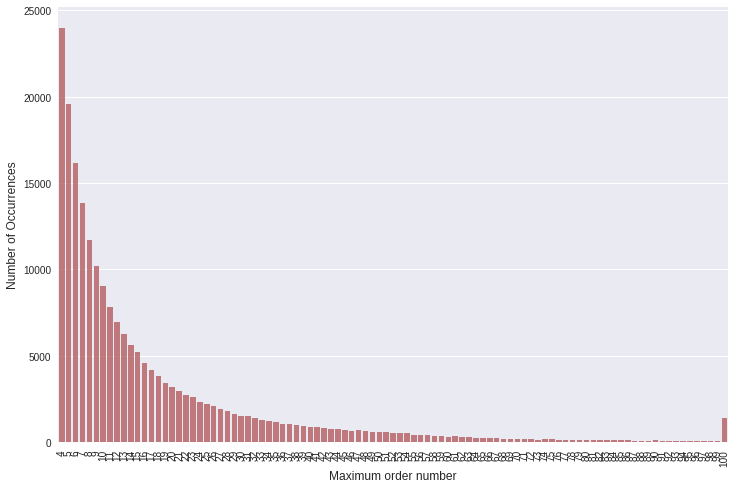
As stated in the problem description, there are no orders less than 4 and is max capped at 100.
Order vs Week/Days
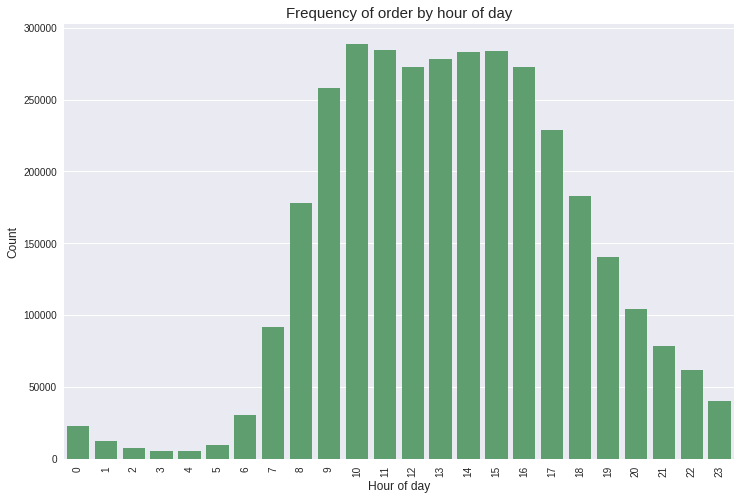
Let’s see how ordering habit changes w.r.t day of week & hour of day
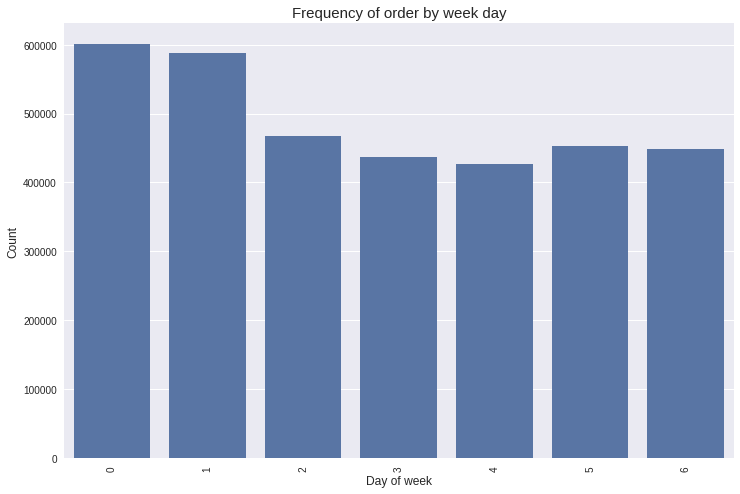
- Frequency of order by day of week- 0 and 1 represents Saturday and Sunday when the orders are high and low during Wednesday
- Frequency of order by hour of day- Majority of the purchases are made during day time, i.e. between 10 am to 4 pm.
Day of week vs Hour of day
Let’s combine the day of week & hour of day to see the distribution
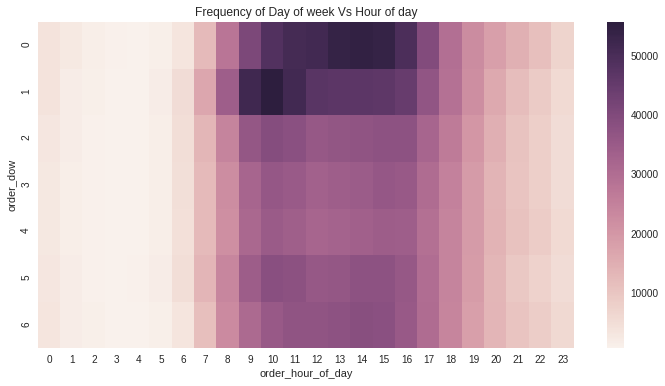
From the graph, we can see that Saturday evenings and Sunday mornings are the prime time for customers to make orders.
Interval between each order
Let’s see the time interval between previous & present orders
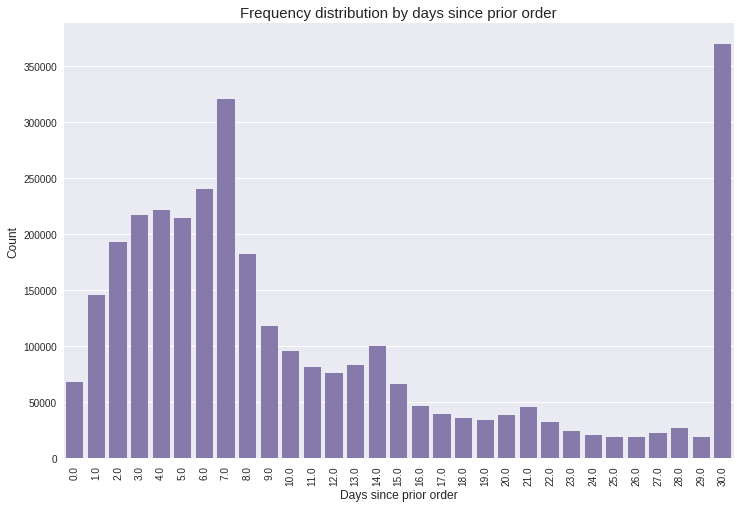
- Graph states that customers order once in every week (peak at 7 days) or once in a month (peak at 30 days).
- Also, we can see that there are smaller peaks at 14, 21 and 28 days (weekly intervals).
Each order contains how many products?
Let’s see no. of products bought in each order & most ordered products
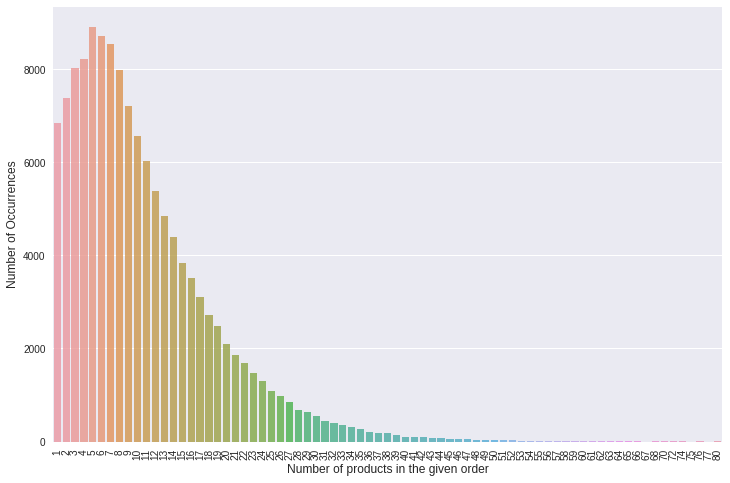
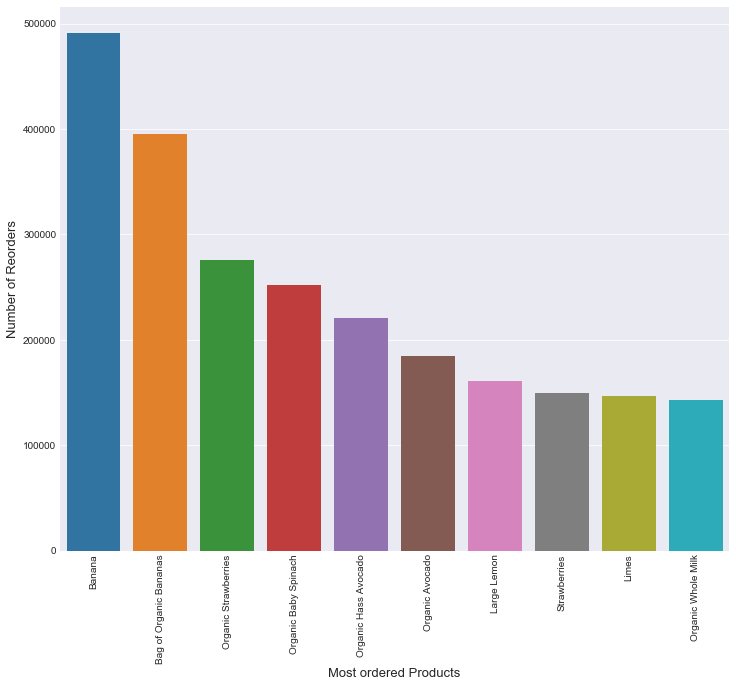
- We can observe from the plot that people usually order around 5 products.
- In particular, the top 5 most ordered products are Banana (491,291), Bag of Organic Banana (394,930), Organic Strawberries (275,577), Organic Baby Spinach (251,705), and Organic Hats Avocado (220,877).
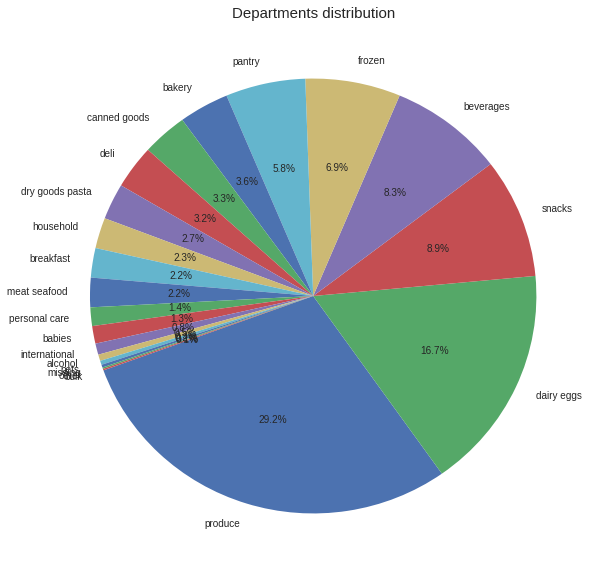
Important Aisles and Departments
Now let’s look at the important aisles and department distribution
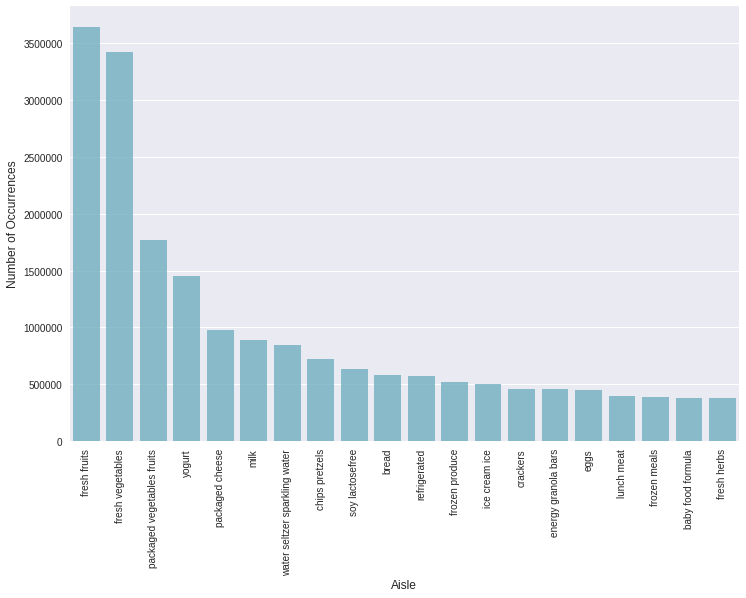
- Top aisles are fresh fruits, fresh vegetables, packaged vegetables and fruit, followed by yogurt and packaged cheese.
- The top department is produce, followed by dairy eggs and snacks.
Reorder Ratio
Now let’s look at reorder ratio of each Department
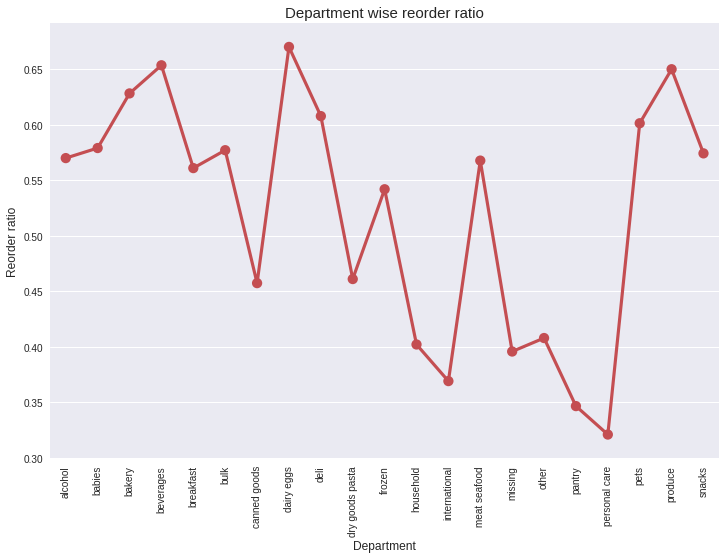
From the point plot, we can find that Personal care has lowest reorder ratio and dairy eggs has highest reorder ratio.
Cart order vs Reorder ratio
Let’s look at the cart order vs the reorder ratio
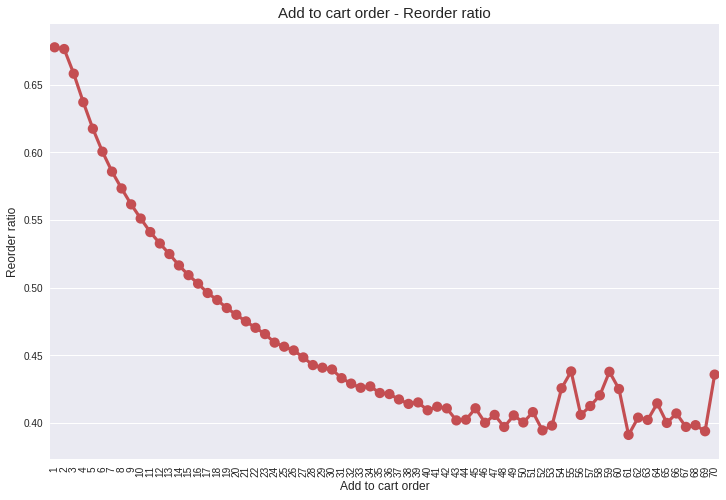
- We can see that the products that are added to the cart initially are the ones that are likely to be reordered again compared to the ones added later.
- This makes sense to as we tend to first order all the products we used to buy frequently and then look out for new products available.
Conclusion
- The dataset is quite big and has many variables that we can analyze. We can further look at association rules in detail between products, investigate consumer reordering patterns in terms of days and hours, reorder ratio vs the hour of the order and so on…
- Some of the business related problems that might have an impact on the revenue are:
- Frequency of customer orders is low ranging from 4–12. What actions can a business take in order the improve the frequency of customer orders?
- Majority of the customers plan their purchases on weekly and monthly cycles. What actions can a business take to improve the purchases for any day of the week and month?
- Besides banana, top items are sold mostly on Monday and Tuesday. Can this be related to an item inventory issue from the retailers?
- Besides the general consumer and market needs, are there any reasons why certain department sales are lower than the others?
-
If you are interested in reproducing this result yourself, you can download the dataset from the Instacart website and view my notebook on GitHub.
-
In the next part of this blog post series, I will do Customer Segmentation, which can help Instacart find the behavioral pattern between their customers and deliver more personalized recommendations based on their needs.